Data-Driven Management
Climate Change is the defining issue of our time and we are at a defining moment. “From shifting weather patterns that threaten food production, to rising sea levels that increase the risk of catastrophic flooding, the impacts of climate change are global in scope and unprecedented in scale. Without drastic action today, adapting to these impacts in the future will be more difficult and costly.” Despite knowing the problem three decades ago, nations have failed to change energy policies quickly enough and the fossil-fuel industry has fiercely resisted change.
You can’t improve what you don’t measure. Businesses and high-performance organizations routinely measure their key performance indicators, and relentlessly prioritize and optimize to achieve their goals. Their goals and metrics are quantified and time-based. Top-level goals are subdivided into sub-goals and objectives, often hierarchically all the way down to individual contributors. Everyone in the organization is focused on optimizing their contribution to the goals and has time-based metrics for their performance. Without a doubt, the fossil-fuel industry is focused on extending their business model and extravagantly rewards managers for doing so.
Stretch goals: Especially when pursuing major changes or ambitious visions, objectives often challenge and stretch the organization like exhausted marathon runners. The most motivated rise to the challenge, and the right goals engender new innovations and resources. Leaders of ambitious change understand the talents and capabilities of their contributors. High-performance leaders rarely fire managers who fail to deliver; rather, they collaboratively examine the targets, the processes being used, and the resources being applied, for opportunities to improve. As soon as managers expect to miss an objective, they raise the issue(s) and propose changes, and leaders jump in to help find solutions.
Reducing GHG emissions is a global stretch goal of existential proportions. The IPCC has studied the impacts of climate change in unprecedented depth and breadth, and wisely summarized the main goal in clear, simple terms—we must at least halve global emissions by 2030. That would have been relatively easy if we’d started 30 years ago, but now Oregon must cut emissions by at least 8% per year through 2030. The top-down goal of 50% by 2030 clearly drives everything—it’s relatively easy to quantify energy-related emissions, and the time available is very clear. (The 2050 target for net-zero emissions is so far away that this often distracts from the urgency of the main goal, which is the trajectory to 2030.)
Implications of 50% by 2030: While top economists have claimed that pricing carbon will save us, the real-world experience of carbon markets is dramatically different. What is necessary are strong, sector-based policies that do the heavy lifting; and sector-based emission targets within a jurisdiction are clearly the most productive. But the opportunities and challenges vary widely by sector, so the sector-based goals can’t simply require every industry to cut emissions 50% by 2030. The difficult-to-decarbonize sectors, like aviation fuels, steel, or cement, will have longer timescales because they are in various stages of R&D that simply require more iterations and more time. Therefore, other sectors must target 50% reductions sooner than 2030.
Technology tipping points
Clean-tech tipping points are generally misunderstood and underestimated. We’re painfully aware of various physical climate tipping points and political tipping points, as demonstrated by the new environmental policies of the Biden administration. But the other salient tipping point is how the costs of renewable energy generation and storage and zero-emission vehicles are either already cheaper than fossil-fuel incumbents or will be soon.
Clean energy is now economic opportunity, not sacrifice. The immediate and local benefits of clean energy obviate the “free-rider” and “tragedy of the commons” paradigms. In 2015 the International Monetary Fund introduced a new financial paradigm, noting that it’s in every jurisdiction’s best interest to capture the co-benefits of clean energy. The co-benefits include lower toxic emissions for lower healthcare costs, lower fuel and operating costs, keeping spending local, developing better energy infrastructure, and others. These co-benefits are all local and immediate–and are significantly larger than eliminating the social costs of climate change, which are global and in the future. And as clean energy gets cheaper, the local and immediate co-benefits of decarbonization increase.
For example, electrifying an average passenger vehicle in the US saves around $1200 annually for fuel, plus other large savings for maintenance. Vehicles are our largest energy expense and our largest toxic and climate emissions. The US kills more people from vehicle emissions than from vehicle accidents. It’s important to note that these co-benefits accrue at any scale—whether a household, neighborhood, city, county, state, or the US.
Technology disruptions can drive rapid adoptions of clean energy. The business strategy implications of technology disruptions are crucial and well known. When the cost-performance of a new technology surpasses the incumbent technology, then every supplier’s market share is reset to zero. The reset triggers a race for market share in the new technology while customers are shopping for suppliers of the new technology. In the case of wind and solar farms the disruption is much slower than consumer products, due to the scale, permitting requirements, and risk averse cultures of utilities and their regulators. In the case of electric vehicles, the disruption is much faster, although not as rapid as smaller purchases like smart phones.
The race for new customer adoptions is likened to being in a tornado, because sales and shipments go exponential. The more adoptions, the more other customers notice what is being adopted; and the more production, the more costs decrease, aiding more adoptions. Winning or losing the race tends to lock in customers for many years, so price incentives during the tornado often don’t reflect a supplier’s production costs. After the tornado the new market leaders will set pricing, and the losers tend to have fire sales or leave the market. Thus the $1.2 trillion of global capital commitments to produce EVs was predictable and the early leaders—Tesla and Chinese automakers—are ramping up production as fast as they can. Leveraging the global race for EV production is the best opportunity for accelerating decarbonization while also saving massively on fuel costs.
Better planning tools for Oregon emissions
Comprehensive, long-term planning: The Green Energy Institute’s 2015 report Countdown to 2050—Sharpening Oregon’s Climate Action Tools provided a comprehensive overview of Oregon’s existing climate change laws and explains why those existing policies would ultimately fail to adequately achieve necessary emissions reductions. The report also recommended strategies for developing a comprehensive climate policy framework in Oregon that would establish binding emission reduction targets and address climate change mitigation opportunities for the energy, transportation, and land-use sectors.
Including technology cost trajectories: By 2019 the cost of operating a coal or nuclear generation plant had exceeded the cost of building and operating a wind or solar farm in many places. The cost trajectory of EV batteries was becoming clear and a classic technology disruption was underway in EVs. But where were the decarbonization models demonstrating these savings? (Some of those results could be traced to obsolete estimates of EV battery costs.)
Power Oregon pioneered the Oregon adaptation of Energy Innovation’s Energy Policy Simulator (EPS): In early 2020, reports utilizing Energy Innovation’s Energy Policy Simulator (EPS) for California concluded that the state’s climate policies were not sufficient to achieve its 2030 emissions goal and that the state would save money by decarbonizing faster. After conferring with Energy Innovation, Power Oregon began work on an Oregon adaptation of the Energy Policy Simulator (EPS) in June 2020, with expertise at the Northwest Economic Research Center (NERC) at Portland State University.
The Oregon EPS: The EPS platform is open-source and very well documented, so that users can see and inspect the data and calculations; or add custom calculations as desired. The data and calculations are non-partisan—historical data is easily verified, and forecast data is confirmed with various forecasters. The EPS has been vetted by national labs and universities. Best of all, the EPS is free and online. Anyone can jump in and learn about business-as-usual projections and various policy scenarios for other countries or US states (models of countries comprising 56% of global emissions are supported), and anyone can select hundreds of policy options to understand sensitivities and create their own scenarios. Video tutorials and full EPS documentation are available here. Energy Innovation experts also provided policy analyses for the Inflation Reduction Act and for the House Select Committee on the Climate Crisis. No longer do serious policy analyses cost thousands of dollars for someone else to enter, run, and interpret a few scenarios. Policy analysis power has come to the people.
The Oregon Energy Policy Simulator provides modeling of key emissions, economic, energy, health, and other parameters, with projections for business-as-usual as well as public or user-defined policy scenarios.
The EPS is non-partisan, open-source, free, and online. Hundreds of policy options reveal policy impacts and interactions.
Insights from the Oregon Energy Policy Simulator
Public scenarios in the Oregon EPS: In March 2022 the Oregon EPS was released with a research note describing five vetted public scenarios, the results of which are summarized here:

Annual results of Oregon EPS policy scenarios relative to BAU: GHG reduction in 2030 and 2050, Change in CapEx + OpEx (Savings), Total Job Creation (Jobs), Gross Domestic Product (GDP), and Monetized Climate and Health Benefits (MC & HB)
Leading on climate: Oregon has emerged as a climate leader for the United States, finalizing rules to slash consumption of natural gas and transportation fuels and ensure 100 percent clean electricity by 2040. However, state policymakers must take additional action to hit Oregon’s greenhouse gas (GHG) emissions targets of at least 45 percent below 1990 emissions by 2035 and at least 80 percent below by 2050, set in Executive Order (EO) 20-04; and to reduce emissions in line with what the International Panel on Climate Change reports is necessary for a safe climate future.
Local and immediate co-benefits of decarbonization: Oregon Energy Policy Simulator modeling shows that increased ambition is not only possible, but that it can create dramatic economic, employment, and health benefits. The deep decarbonization scenario, consistent with the U.S. Nationally Determined Contribution under the Paris Climate Agreement (NDC Scenario), would reduce Oregon’s GHG emissions by 74 percent compared to 1990 levels and save nearly $11 billion annually by 2050. This is not surprising—clean technologies are often the cheapest sources of energy today.
Transportation electrification: Obviously not all decarbonization actions will save money, but some actions can save markedly. For example, electric vehicle (EV) prices continue to fall and are expected to reach upfront cost parity with internal combustion engines within a few years, meaning lifetime costs are typically already lower when accounting for fuel savings (around $1 per gallon equivalent fuel cost in the Northwest.) These favorable economics make EV support one of the most cost-effective policies in the modeled scenarios, generating significant consumer benefits while also decarbonizing one of Oregon’s largest sources of emissions. This makes perfect sense, given that EVs are about four times as energy-efficient as gasoline or diesel vehicles, and Oregon now imports around $8 billion of gasoline per year. (The energy in gasoline at $3.37 per gallon is the same energy cost as electricity at $0.10 per kWh.)
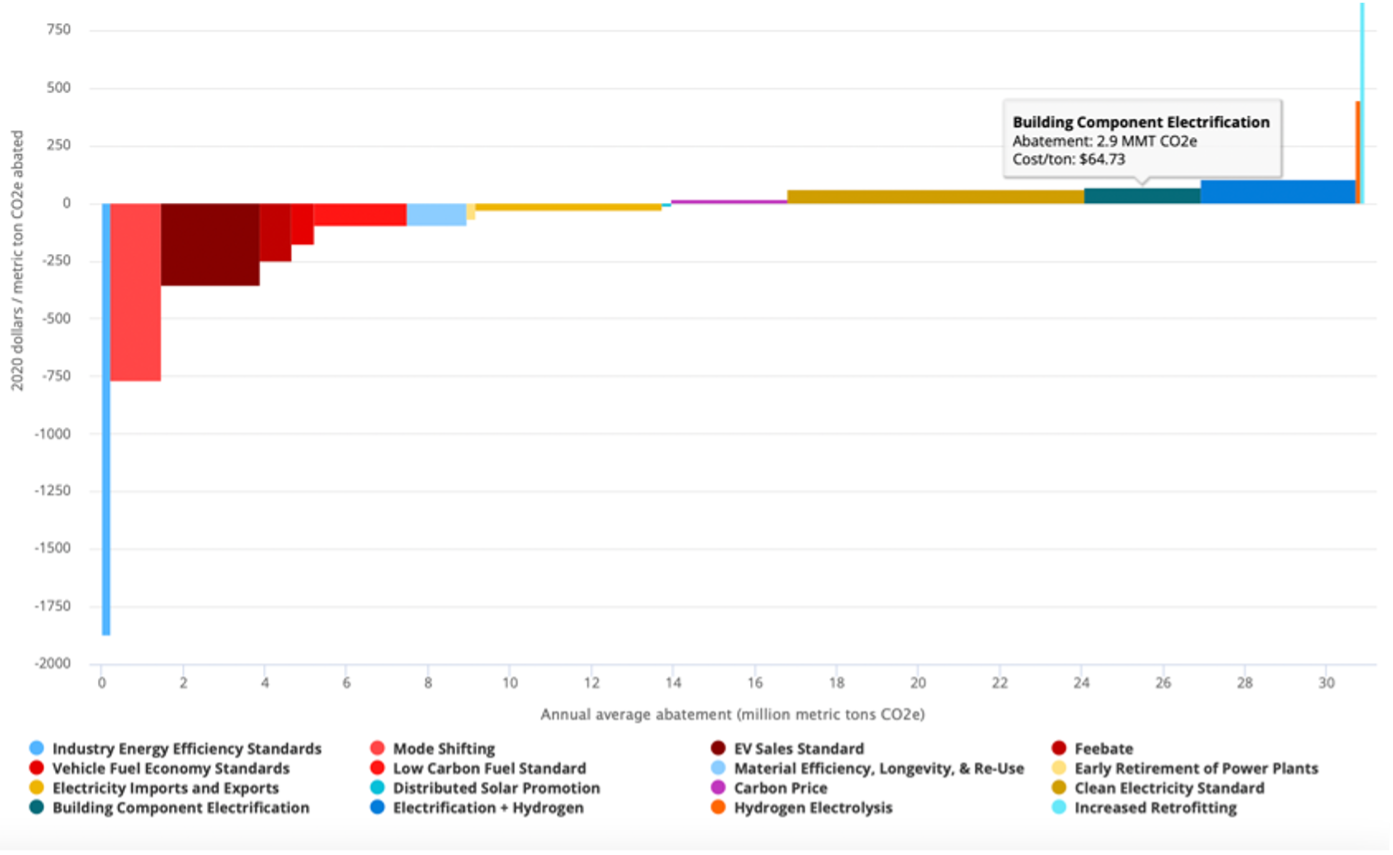
Marginal Abatement Cost (MAC) curve illustrates large savings from more efficient transportation policies (red).
Other cost-savings opportunities: Many other cost-saving policy opportunities are available, such as adopting efficiency standards and policies to promote public and non-motorized transit, which deliver cost benefits due to large fuel savings. As this research demonstrates, the earlier these measures are adopted, the greater the savings. Therefore, swift action to take advantage of cost-saving decarbonization policies will be critical for Oregon.
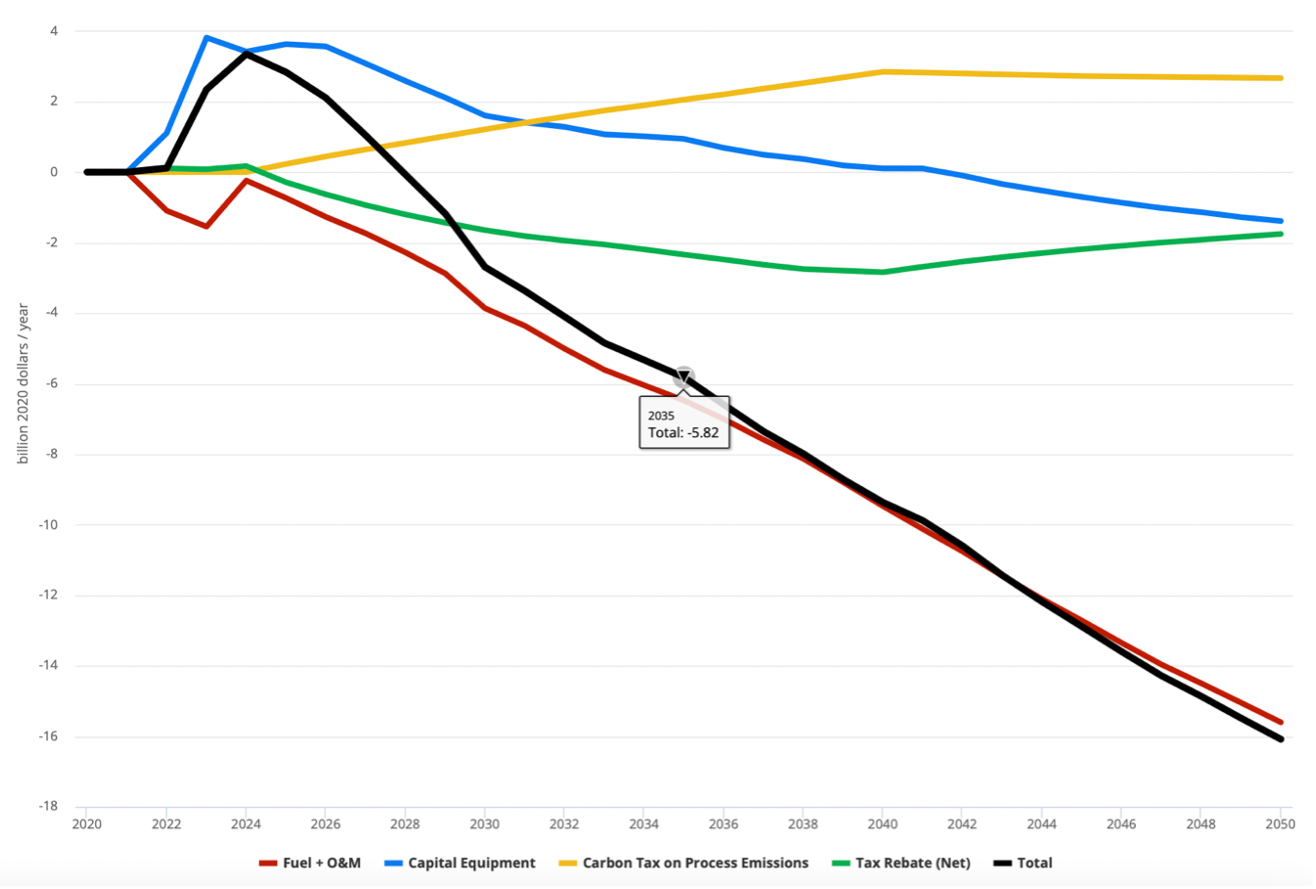
EPS modeling confirms the savings possible with rapid decarbonization, over $5 billion/year by 2035 in this scenario.
Job creation: These investments offer major opportunities to boost statewide workforce and economic activity. The more ambitious scenarios generate greater benefits. For example, a scenario incorporating the Climate Protection Program (CPP Scenario) on top of Oregon’s recent clean electricity and transportation policies delivers far more economic benefits than the recent policy developments alone. And the CPP Scenario adds 9,500 net jobs and boosts Gross Domestic Product (GDP) nearly $2.5 billion in 2050, while the more ambitious NDC Scenario generates 18,000 net jobs and boosts GDP nearly $4 billion in the same year.
Health benefits: Avoiding local sources of air pollution also generates significant public health benefits. The NDC Scenario avoids over 800 asthma attacks annually and delivers nearly $5 billion in monetized public health and climate benefits in 2050, compared to the CPP Scenario which avoids 600 asthma attacks annually and delivers more than $3 billion in monetized public health and climate benefits in 2050. We find that benefits are greater across the CPP and NDC scenarios for people identifying as Black, with the percentage change in avoided deaths for people identifying as Black averaging 1.6 times higher than avoided deaths for people identifying as white in 2050.
How to incentivize new infrastructure: The Oregon EPS confirms that carbon pricing policies have relatively weak impacts on emissions. For example, in 2013 the emission and economic impacts of a $60/MTCO2e carbon tax were analyzed by NERC, finding approximately 10% GHG reduction by 2050 and little economic impact. Applying a $60/MTCO2e carbon tax to all sectors in the business-as-usual (BAU) scenario of the Oregon EPS finds a 6.5% emission reduction by 2050 (less than 10% partly because the BAU scenario includes SB 1547, unlike the 2013 study.) Even at $150/MTCO2e the impacts are relatively small, and even smaller when applied with HB2021, because HB 2021 is doing the heavy lifting to decarbonize electricity.
Understanding carbon pricing: In practice, carbon pricing policies necessarily interact with sector-specific emission policies, making it difficult to separate the impacts. A recent book expertly analyzes how the California-Quebec, EU ETS, and RGGI cap-and-trade systems operate in the real world vs the economic theory. One major limitation of cap-and-trade, or any carbon tax, is that the carbon price is limited by political realities. Thus, to maintain price stability, cap-and-trade administrators create many free allowances. Obviously there’s a fuel price at which consumers will reduce their demand, but that price is very high.
Clean infrastructure: Achieving the state’s climate targets will require new, clean infrastructure. Simply adding fuel taxes will not significantly cut emissions, whereas non-emitting vehicles and buildings will. Oregon EPS modeling finds fuel switching—for example adopting more transportation biofuels to comply with the state’s Clean Fuels Program—is only a part of the solution. Deep decarbonization will require shifting nearly all of Oregon’s purchases of new vehicles to EVs and supporting charging infrastructure buildout. In addition, replacing fossil fuel equipment in buildings and industry with electric and other zero-carbon alternatives will be critical.
A common language: The EPS is an excellent tool for creating a common language and database, and for pathfinding and outlining a long-term energy/emissions plan for a state. Without a top-down plan and accurate analyses, clean-energy progress gets distracted or delayed by policies and debates with limited or inefficient emission impacts. Open-source data and modeling can provide a common language for stakeholders, since all stakeholders can quantify the massive economic savings and reductions of climate and toxic emissions from policies like the Clean Trucks Rule and Advanced Clean Cars II, along with job creation, GDP growth, health impacts, and more.
Next steps
More policies needed: Oregon’s existing policies, notably House Bill 2021 which sets a timeline for 100 percent clean electricity, the Clean Fuels Program, the recent Clean Trucks Rule, and the CPP, create a solid foundation for additional climate action. Now key policies to further accelerate emissions reductions include stronger EV sales standards (particularly Advanced Clean Cars II), standards and incentives to support fully electric buildings and transition industrial equipment to a mix of electricity or hydrogen, and policies to promote further carbon sequestration through the state’s forests. Even though the US NDC Scenario incorporates these ambitious policies, it does not fully meet Oregon’s climate targets as defined in EO 20-04, highlighting the need for other policies, such as even faster adoptions of clean infrastructure or additional agricultural practices.
Moving from sacrifice to opportunity: Fossil fuel companies continue to message that clean energy is far too expensive, when the opposite is true. The decarbonization narrative needs to shift to “gain not pain” or “opportunity, not sacrifice”, to educate stakeholders on the economic and other co-benefits. Saving money by decarbonizing has become a bipartisan opportunity. There’s no need to punish parties for fueling the infrastructure they own—it’s better to reward them for buying new non-emitting vehicles or buildings. We should make energy cheaper, not more expensive. The paradigm has shifted.
Further policy opportunities: While clean energy clearly delivers numerous benefits, the state must adopt policy tools to encourage this growth and ensure that new investment decisions lead to clean rather than polluting infrastructure. Early and sustained action will be key to delivering the scale of necessary emissions reductions and realizing the economic and health benefits of strong climate action. (See the Green Energy Institute’s Oregon Policy Pathway Study, below.)
Financing: Since most clean energy applications are cheaper to operate, a major opportunity and unmet need now is financing. Incentives in the federal Inflation Reduction Act are a huge help for accelerating clean energy buildouts, but clean energy is still out of reach for many low-or medium-income families. The state should create or incentivize more financing options for new or used zero-emission vehicles, for electrifying buildings, and for improving the efficiency of new or existing building envelopes. Electric utilities are the beneficiary of electrification, and utility regulators should consider on-bill tariffs or other funding options to help consumers, businesses, and jurisdictions electrify their vehicles and buildings.
Limitations: Any simulator has limitations in the scope and scale of the inputs and outputs. For example, the EPS does not model any details of the electric grid, such as peak power demand or transmission or storage options, vehicle-grid integration (VGI), integration of hydrogen hubs or pipelines, etc. The EPS uses economic modeling at a state level, with some health impact modeling from EPA reports at the zipcode level. Modeling economic impacts at a county level is difficult beyond energy consumption, since most of the state-level economic or energy data doesn’t exist at a county level. The EPS does not model policies for financing clean energy capital costs or payback periods. The EPS does not model detailed policy parameters, such as clean-energy rebates for different income levels or specific to certain products. Etc. In theory, python scripts could be added to the Oregon EPS to perform anything, although that can involve strong programming expertise and funding.
Green Energy Institute Oregon Policy Pathway Study
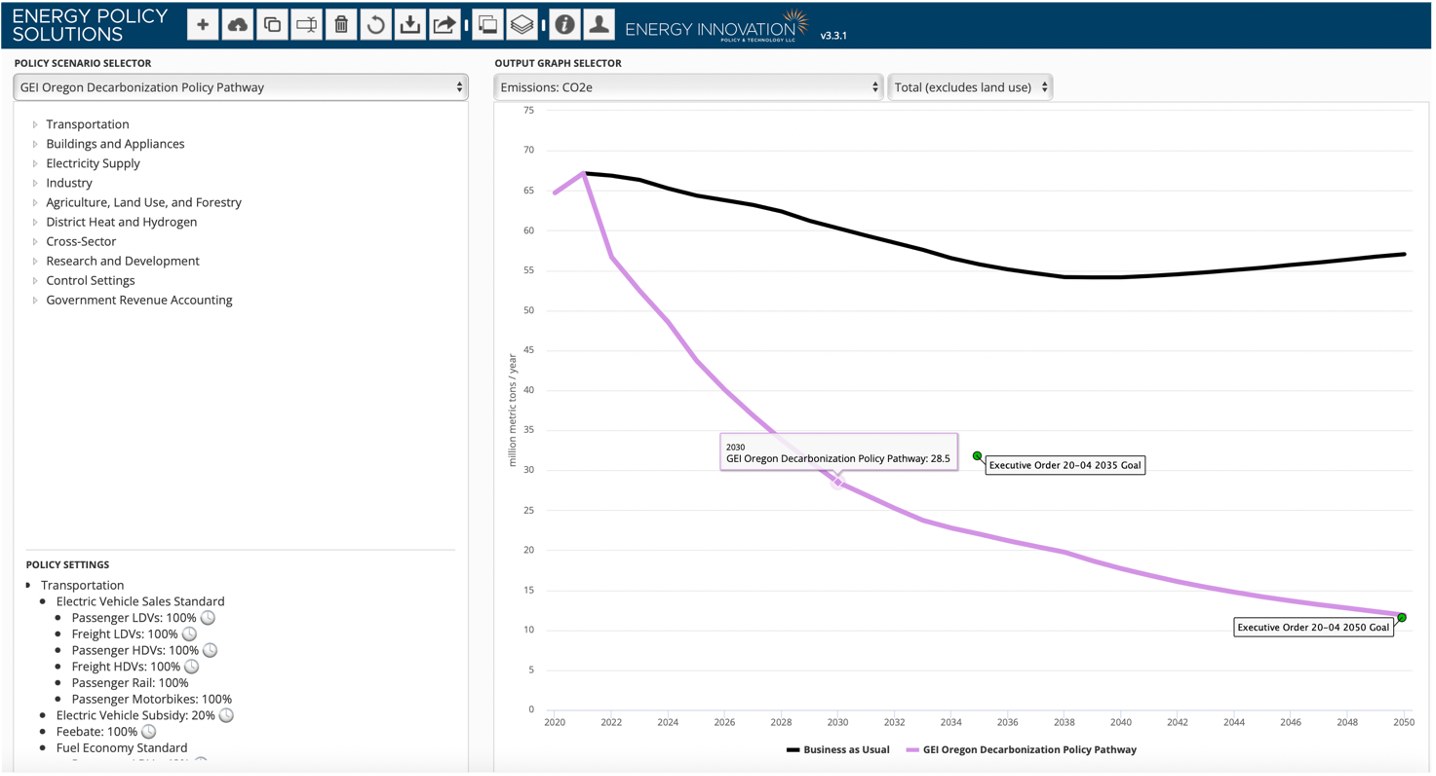
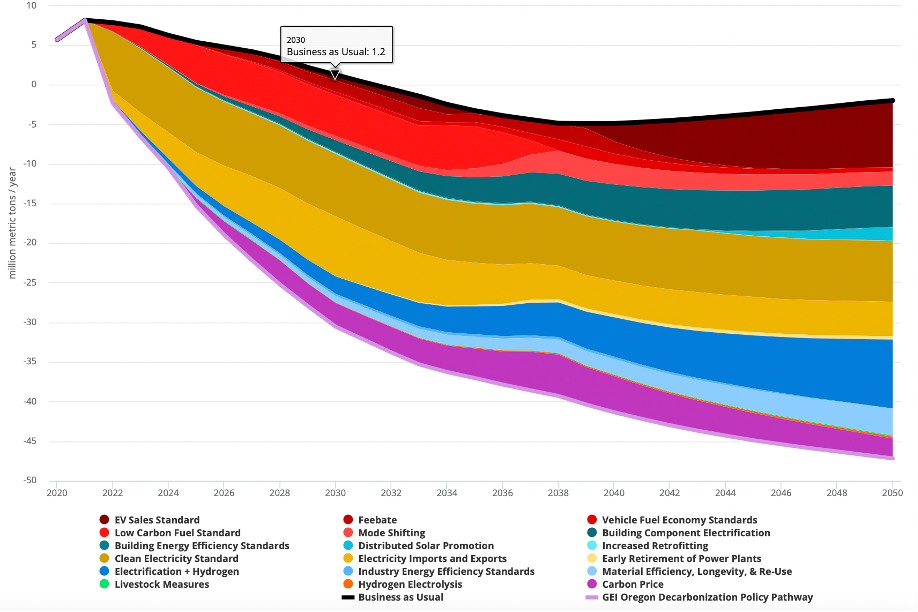
In September 2022 the Green Energy Institute at Lewis and Clark College (GEI) released the first comprehensive, long-term plan for Oregon greenhouse gas emissions. There have been prior decarbonization studies that show physical feasibility scenarios for Oregon, but this 6-month study is the first to analyze and optimize the specific policies necessary to equitably, effectively, and economically implement emission reductions that reach and exceed state targets (not including forestry or agriculture emissions or sequestration.) The Oregon EPS aided in the creation of this study. Headline numbers of this pathway scenario include:
- Reduce emissions by 45.2 million metric tons carbon dioxide equivalent (MMTCO2e) by 2035 and reduce emissions by 55.3 MMTCO2e by 2050, achieving Oregon’s GHG reduction goals (and achieving the EO 20-04 2035 goal by 2028);
- Equity analyses by major policy (qualitative);
- Create nearly $200 billion in total cost savings by 2050, with annual cost savings averaging $7.46 billion per year between 2025 and 2050, from a total investment of about $12 billion through 2028;
- Increase Oregon GDP by $68.5 billion between 2022 and 2050;
- Create more than 12,000 new jobs for Oregonians;
- Prevent dozens of premature deaths each year;
- Avoid 20,000 asthma attacks between 2022 and 2050;
- Avoid 346 non-fatal heart attacks between 2022 and 2050; and
- Avoid 105,000 lost workdays between 2022 and 2050.
For each major policy recommended, the study analyzes 1) Oregon’s existing policy and regulatory framework, and any policy changes currently under consideration; 2) the specific policy action needed for Oregon to achieve emissions reductions in a cost-effective and equitable manner; 3) the type of action needed (legislative, regulatory, or administrative); 4) when policy action is needed; and 5) the key benefits that are projected to occur as a result of the specific policy action, including emissions benefits, equity benefits, and economic benefits.
Public access: The policy inputs and results of this scenario are public at this link. GEI ran hundreds of simulations in the process of exploring and optimizing this scenario. The study notes that this is only one possible pathway, and other scenario variations can optimize different combinations of economic vs equity vs emission priorities. It is unclear how such a thorough study could be performed without direct access to the modeling inputs and outputs.